

Wondering whether financial business intelligence (BI) is a prospective investment for your company? Then look at what Forrester predicts for this year:
- More than 50% of under-50 FinTech users will refer to GenAI tools for financial advice. GenAI tools collect financial data and let the audience ask questions, get meaningful answers, and make the right budgeting decisions. Financial BI can be trained on the same data as GenAI. If you’re already using AI in your business, implementing BI will be a natural next step.
- Around 50% of Tier-1 financial companies will implement smart agents for their back-office tasks. One-third of all back-office responsibilities will be automated with smart technologies, including BI and AI. Each step and decision will be data-driven and orchestrated. This will mark a shift from generic workflows to role-specific and automated operations.
So, you see, if you’re already collecting financial data on a daily basis or using AI in your operations, you have a solid foundation for implementing financial business intelligence. And this article will show you what steps to take to make this implementation smooth and hassle-free.
Keep reading to uncover the impact of financial BI on your business, top BI tools to consider, and key steps for implementing this technology in your FinTech company.
Why Business Intelligence for Financial Services Can Be Your Competitive Advantage
To put it simply, financial BI is like the brain of your company. It’s an umbrella term covering strategies, tools, methods, algorithms, and technologies used to collect and manage financial data. The main BI components include:
- Data sources: CRM, ERP, spreadsheets, or other databases from which data is extracted.
- Data warehouse: A centralized place for storing and organizing data.
- Online analytical processing (OLAP) tools: Algorithms for data analysis, pattern identification, and trend forecasting.
- Data visualization: Interactive dashboards for quick and easy access to data.
You can configure financial business intelligence differently, depending on your goals, timelines, budget, toolset, and expectations.
Apart from adaptability, business intelligence in finance also offers practical pros. Here are some of the technology’s benefits:
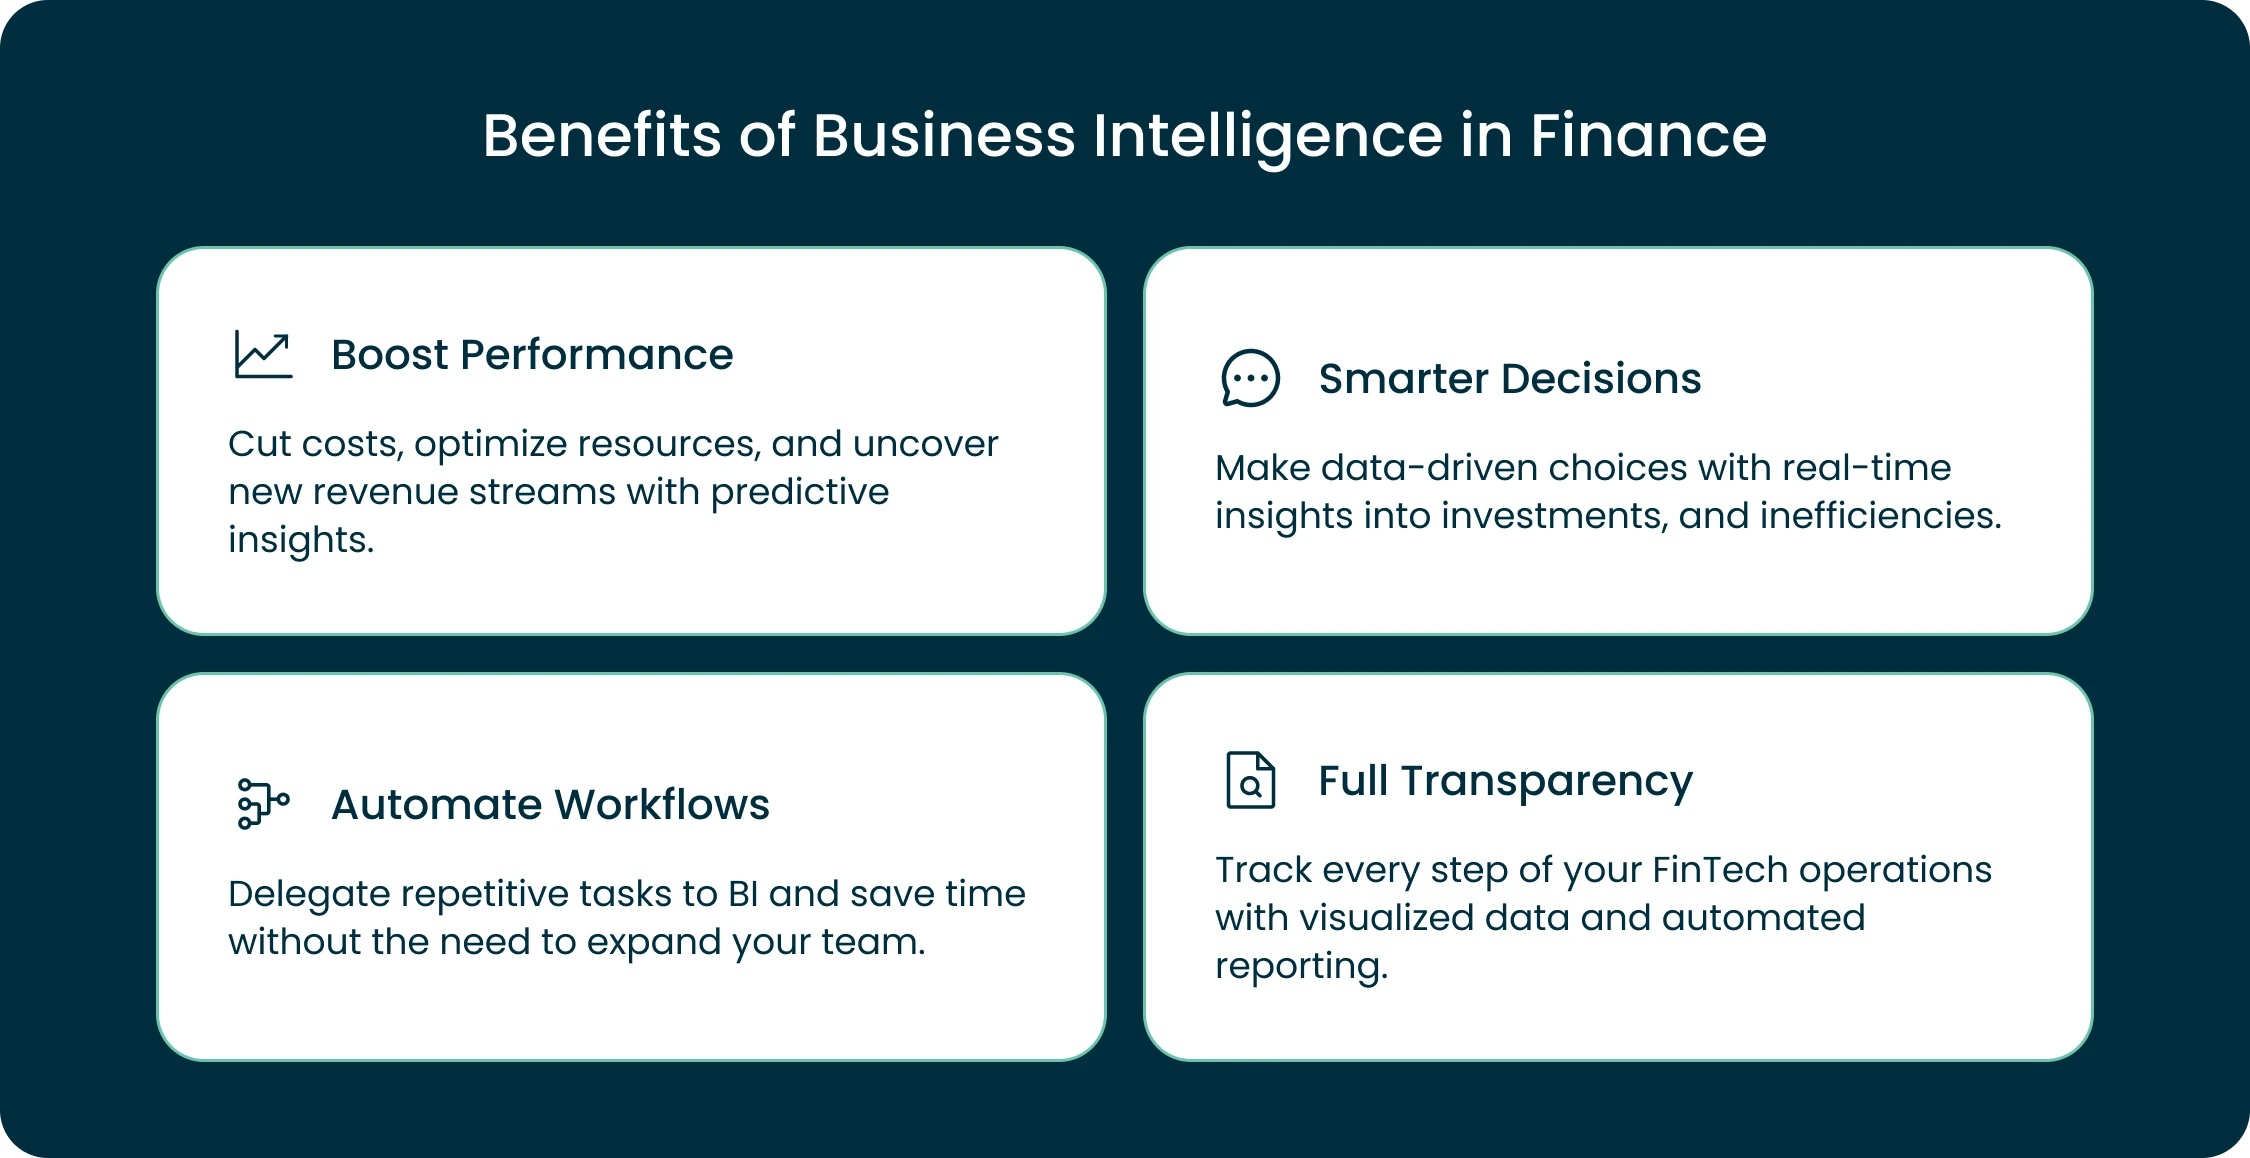
- You automate a large volume of work. A single BI investment handles data collection, management, and KPI analysis. Your company processes more work in less time without hiring additional staff.
- Your business decisions are smarter. With financial business intelligence, you get access to the latest data and insights into budgets, investments, and inefficiencies. You no longer rely on risky decisions or intuition but instead build a thoughtful business strategy, considering both your strengths and weaknesses.
- You gain more transparency. Any piece of raw data can be checked by BI stakeholders in real time. Enhanced by data visualization and automated reporting, business intelligence in finance makes it easier for non-technical staff to track every operational step. This ensures regulatory compliance and transparency throughout your organization.
- Your insights are data-proven. Based on historical trends and data analytics, intelligent technologies can predict what will happen in the financial sector tomorrow, including trends in customer behavior, sales, market fluctuations, and risk assessment. As a result, you can anticipate global changes and minimize disruptions to your business.
Looking to automate financial processes and save time? Get in touch with our team to streamline operations and reduce manual work.
How Business Intelligence Solves Real Financial Challenges
The positive impact of BI on financial businesses is undeniable. According to the latest data, more than 78% of global enterprises have implemented at least one BI or analytics platform by 2025. Often, one BI solution is enough for a FinTech company to reach all their business goals.
To figure out the project’s scope and the number of required solutions, you need to know how many BI applications your company needs to implement. Here are the core BI use cases in the financial sector to help you choose from:
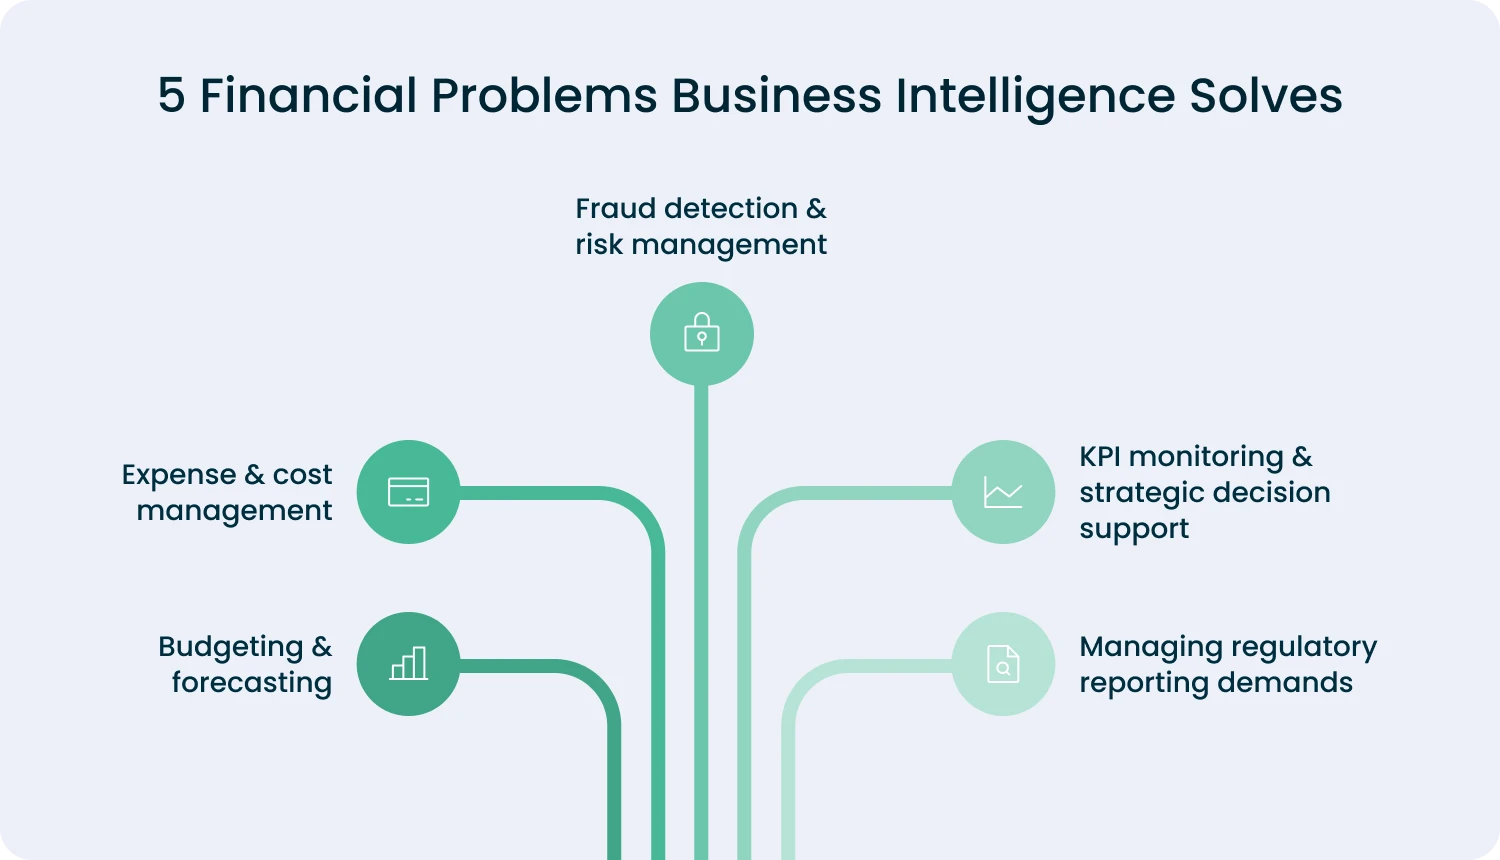
Fraud detection and risk management
To minimize fraud and manage risks, your company needs to analyze data in real time. Manual checks are almost impossible at scale, which is why financial professionals rely on BI tools.
Financial business intelligence solutions monitor vast volumes of raw financial data. They help you detect money laundering, spot identity theft, and prevent threats. Unlike static tools that are easy to bypass, ML fraud detection algorithms recognize patterns and proactively mitigate risks.
Expense and cost management
What differentiates business intelligence tools is their powerful cost management functionality. Business intelligence in finance collects raw data from multiple sources, creating a single source of truth for your finance department.
The system allows your teams to analyze data consistently, identify inefficiencies, and track key performance indicators without manual consolidation.

Budgeting and forecasting
With predictive analytics and scenario modeling, BI solutions help finance teams track cash flows, expenses, and revenue. Changes in user behavior are detected automatically. This allows teams to adjust budgets dynamically.
KPI monitoring and strategic decision support
Financial BI centralizes key metrics in one place, enabling teams to monitor KPIs, track growth, churn, and liquidity, and receive automated data-driven insights.
BI supports data-driven decision-making, risk management, and strategic initiatives like market expansion, pricing, or investment planning. The technology combines historical trends with predictive analytics, which helps identify trends and reduce uncertainty.
Managing regulatory reporting demands
If your business relies on industry standards or regulatory requirements like SOX or GDPR, business analytics systems can save your team weeks spent manually compiling reports. BI platforms automatically track and document financial transactions according to regulatory requirements and instantly generate audit-ready reports formatted to compliance standards.
Top Financial Business Intelligence Tools Companies Use to Drive Smarter Decisions
From practical experience, the most effective BI platforms for business intelligence in financial operations are Power BI, Tableau, and Looker. Nearly all companies we have worked with in the financial services industry rely on one of these tools for analytics and reporting needs. These platforms provide immediate access to complex financial data, which helps finance teams make informed decisions.
The mentioned BI solutions work particularly well for finance teams because they integrate with popular financial systems. In addition, they offer strong data transformation and visualization features. These capabilities are critical for analyzing customer data and tracking key financial metrics that measure an organization’s financial health.
We have hands-on experience with all three tools, so below are the main insights that can help you decide which option fits your team best. If you need expert guidance on choosing business intelligence tools, feel free to contact Forbytes.
Power BI

Power BI is a cloud-based BI solution by Microsoft that supports connections to more than 250 data sources.
- Pricing: Starts at approximately $14 per user per month, and the tool offers robust data modeling and transformation functionality.
- Best option for: Organizations already using Microsoft products like SharePoint, Dynamics, Azure, or Excel. Power BI integrates seamlessly into this ecosystem. This reduces setup time and lets you embed financial reports directly into existing workflows.
If you already have a Microsoft Office E5 license, Power BI is included at no extra cost. No wonder it has become the go-to choice for our clients in financial environments. Their teams use it daily to track actual financial performance and revenue streams. No additional software expense required.
Tableau

Tableau is part of Salesforce and connects to more than 150 data sources.
- Pricing: Tableau charges based on what users do in the platform. For the viewers who only need to see dashboards, the platform charges around $15 per month, while creators who build custom charts and reports pay up to $75 per month.
- Best option for: Organizations that prioritize polished and complex visualizations. In the financial industry, this level of sophistication helps teams identify patterns and gain a deeper understanding of historical data, supporting operational and strategic decisions.
In practice, Tableau performs just as well as Power BI for financial BI use cases. If your organization is not tied to the Microsoft stack and your team prefers Tableau’s interface, it is a perfectly valid choice to anticipate future trends and optimize marketing strategies.
Looker

Looker is a Google-owned, enterprise-focused BI platform.
- Pricing: Google Looker BI pricing depends on a few components: platform edition, user licensing, and conversational analytics usage measured in tokens. On Google’s website, you’ll only find token pricing — $3 per 1M input tokens and $20 per 1M output tokens. However, you can use their pricing calculator to estimate the cost for your particular use case.
- Best option for: Organizations that need to integrate dashboards into internal systems or customer-facing applications. Looker excels at embedded analytics, letting finance teams analyze banking trends and anticipate shifts in FinTech and industry markets directly within their existing tools.
One of Looker’s strongest advantages is collaboration. The BI platform allows multiple developers to work on the same dashboards simultaneously, providing valuable insights for larger analytics teams. Looker also supports data warehousing and data encryption, ensuring compliance with financial regulations.
Proven Approach to Implementing Business Intelligence in Financial Services
Now that you know a lot about BI, its benefits, applications, and top tools, we can move to the practical side of the question — implementing this technology in your business.
Below, we present a general strategy that breaks down into narrower steps depending on the project’s goals, chosen tools, and business expectations. Consider this strategy as a high-level guide to turning financial BI into your business power.
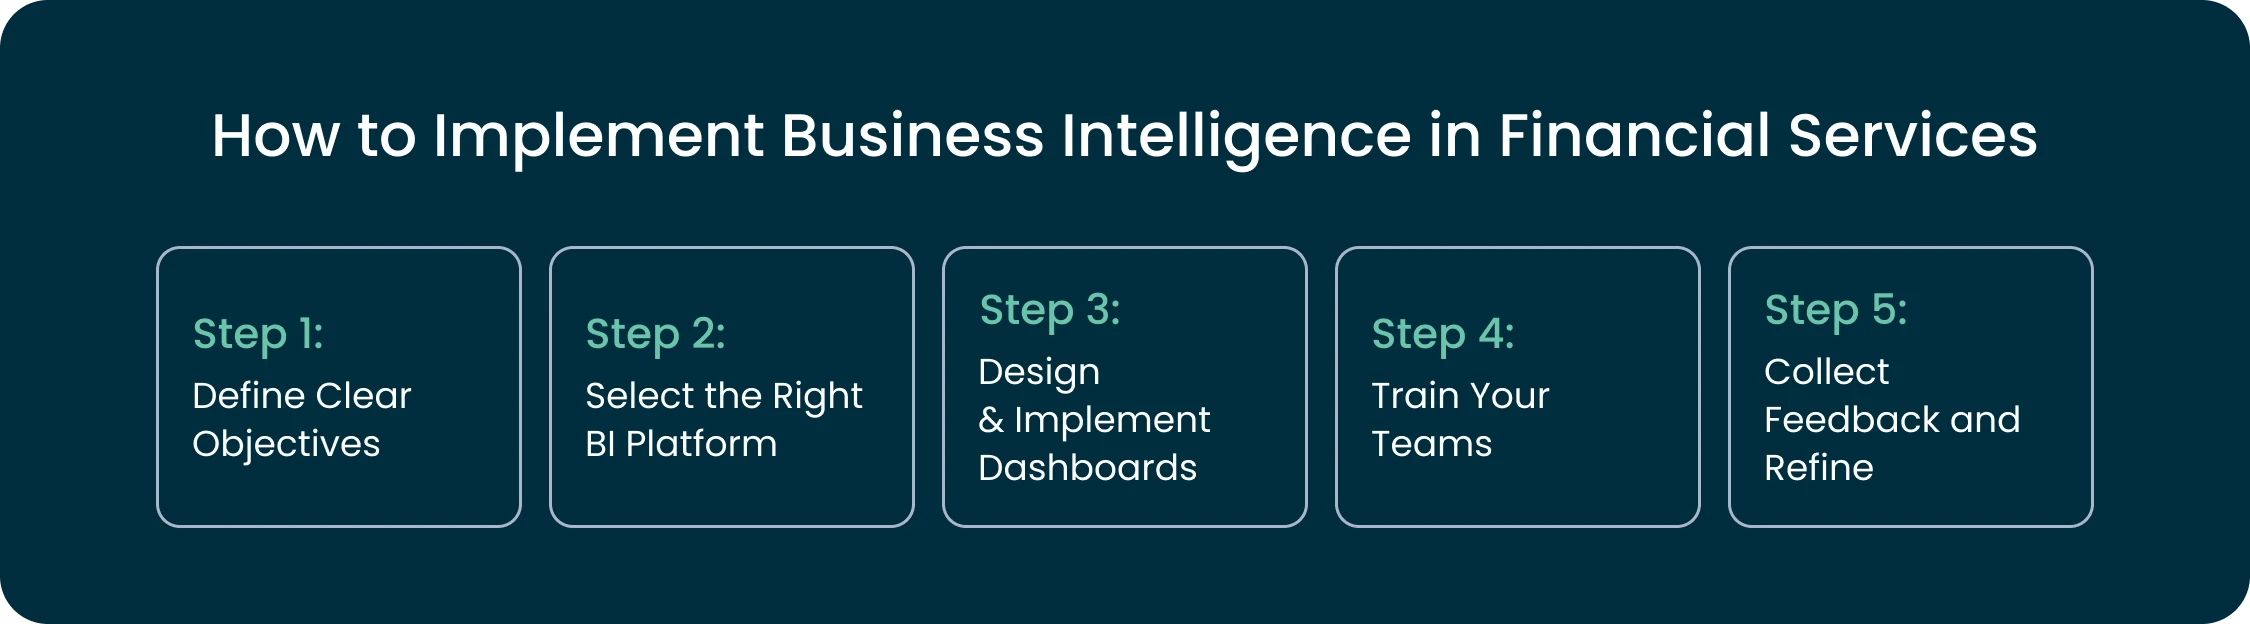
1. Define clear objectives
Start by outlining your goals for implementing business intelligence in financial services. Assess current data sources and make a list of the ones that your company will use for BI-driven data analytics:
- Select sources that provide accurate, complete, and timely data;
- Make sure the sources are regularly updated and can be integrated with other tools;
- Avoid including systems that don’t directly impact the metrics you want to analyze, because extra data adds complexity without value.
2. Select the right BI platform
he choice depends on your financial services industry segment. Retail chains often use Tableau to analyze customer data and improve marketing strategies. Meanwhile, FinTech companies might prefer Looker for historical data analysis.
It’s important to make this choice responsibly. The BI platform will form the core of your BI strategy, and you will spend time and resources on its integration into your IT environment. If you are hesitating between options, let our BI experts study your business and consult you on the most effective solution.
3. Design and implement dashboards
Dashboards display key financial metrics and allow teams to track actual financial performance. Properly designed dashboards improve strategic decision-making. They help leaders gain a deeper understanding of complex financial data.
What’s more, dashboards help non-technical team members access and interpret data. As a rule, non-technical teams have creative problem-solving skills that may be useful for your business strategy. Data visualization and dashboards help them access data directly, explore trends on their own, and contribute insights to financial discussions without needing technical expertise.
4. Train your teams
Implementing a smart solution is only halfway toward effective business functioning. Another part lies in the practical application of this solution by your team. You can spend a fortune on the most effective tools and get no results simply because your staff avoids using BI.
To prevent this, prepare a detailed training plan. Involve the specialists you engaged in BI development, organize workshops, and create questionnaires for your employees to share how the changes are going.
5. Collect feedback and refine
Continuous refinement allows organizations to maintain financial stability, improve data quality management, and optimize business operations. We recommend that you regularly collect team feedback on FinTech BI implementation.
The insights gained at this step will help you refine your BI strategy in a way that meets both your business objectives and internal operational needs.
Financial Business Intelligence Designed Around Your Reality: Real-Life Case Study from Forbytes
With BI, anything that can be translated into data becomes a powerful instrument for revenue growth and resource optimization.
Building an advanced BI platform for NoWaste is one of the success stories. Using it, we’ll show you the key benefits of business intelligence in finance and the well-planned implementation process.
The challenge
NoWaste, a leading European logistics company, has systems that track everything from warehouse ops to billing.
What could be a problem if a company is already tech-savvy, you may ask? Simple as that: over time, all that data became impossible to manage:
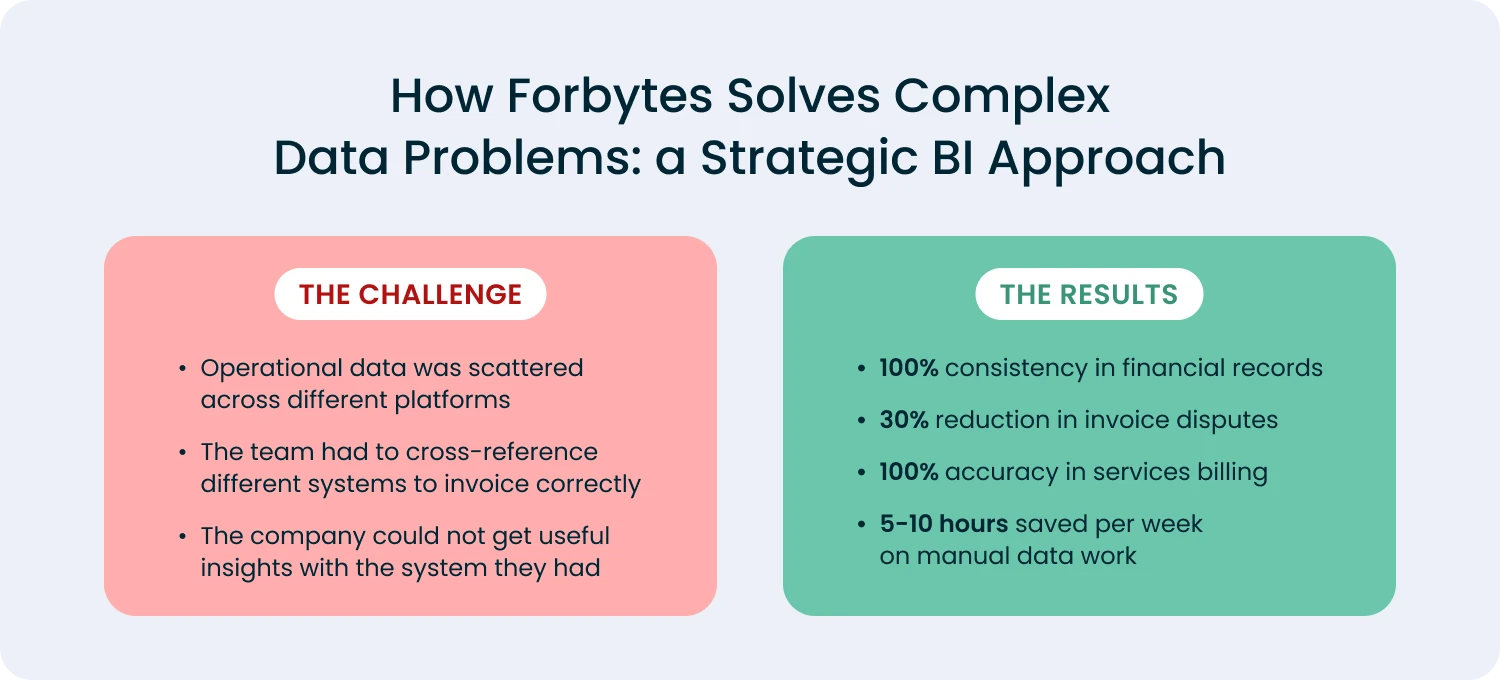
- Their operational data was scattered across WMS, ERP, and HR platforms. Every time the team needed data, they should have manually pieced things together;
- The team had to cross-reference different systems to invoice correctly.
- NoWaste couldn’t get useful insights with the system they had.
Forbytes’ approach
The project was large and took 30 weeks to implement. We delivered strong results because of two factors:
- NoWaste knew exactly what they wanted to achieve and prepared solid documentation;
- Forbytes’ team aimed to design a solution that tackled each pain point and created a step-by-step BI implementation strategy.
Here’s what our team did to address the challenge:
First, we pulled data from all NoWaste source systems and converted it into Parquet files (a super-efficient file format for storing massive amounts of data). Then we set up ETL pipelines using Databricks to handle ongoing data loads.
Then, Forbytes’ team implemented Medallion Architecture on Azure:
- Bronze layer: Raw data straight from the source systems; we need to keep it for historical records and auditing;
- Silver layer: The system matches, merges, and standardizes the data here; this is the “single source of truth”;
- Gold layer: On this level, business-ready data is enriched and optimized for reporting.
The next step was doing heavy lifting like calculations, transformations, and all the business logic inside Databricks. We managed to do it using dbt (the industry standard tool).
As a final stage, Forbytes developed Power BI dashboards that turned complex data into efficient reports.
The results
- Data accuracy: NoWaste hit 100% consistency in financial records and cut invoice disputes by 30%.
- Zero revenue leakage: Now the company is capturing and billing 100% of services.
- Speed: Reports now generate in seconds.
- Time saving: Each department is saving 5-10 hours per week on manual data work.
Your finance team can have the same clarity and control with the right BI implementation. Contact us to see how we can build a solution for your business.