
If you’re running an eCommerce business, then chances are you’re using some kind of dashboard to help manage your operations. Dashboards can be incredibly useful for providing insights into your business, but with so many different options available, it can be hard to know which one is right for you.
In this guide, we’ll look at the benefits of eCommerce dashboards and list some metrics you need to consider when choosing one. Let’s get started.
What Is an eCommerce Dashboard?
An eCommerce dashboard is a central location where businesses can track and manage their online sales. This can include tools for managing inventory, processing orders, tracking shipping, and handling customer payments. An eCommerce dashboard can also provide insights into sales data, helping businesses to make informed decisions about pricing, marketing, and product development.
In many cases, a dashboard is integrated with other business solutions, such as accounting and CRM platforms. This gives businesses a holistic view of their operations, customers, and bottom line. By tracking key performance indicators (KPIs), businesses can see where they are succeeding and where they need to improve.
The best dashboards offer a variety of features, including live data, custom reports, and drill-down capabilities. Some dashboards also offer more detailed insights, such as average order value, time to purchase, and product page views. With the right data at their fingertips, businesses can make informed decisions that will help them grow and succeed in the competitive world of eCommerce.
How Might an eCommerce Dashboard Benefit Your Company?
Running a successful online business is all about making data-driven decisions. From knowing which products are selling well to understanding where your website visitors are coming from, the data you collect can give you insights that will help you grow your business. However, sorting through all of your data can be a time-consuming task. That’s where an eCommerce dashboard comes in.
An eCommerce dashboard consolidates all of your important data into one easy-to-use interface. This allows you to quickly see how your business is performing and make decisions accordingly. In addition, a dashboard can be customized to show only the data that is relevant to you, making it even easier to find the information you need.
An eCommerce dashboard is a powerful tool that can provide valuable insights into the performance of your online store. By tracking key metrics such as website traffic, conversion rates, and order value, you can identify areas where your business is doing well and identify opportunities for improvement.
With an eCommerce dashboard, you can see at a glance how your team is performing against key metrics. This visibility helps identify areas of improvement and provides a clear motivation for the team to improve their performance. By tracking progress over time, you can also spot trends and ensure that everyone is working towards the same goals.
Making sure that any significant flaws or problems are quickly identified so they can be remedied is one of the most frequent types of use cases that a dashboard supports. Dashboards can inform you of a variety of things, including:
- Slow loading times: If your website is loading slowly, it could be a sign that your hosting plan needs to be updated or that your server is overloaded. Either way, it’s important to address the issue as soon as possible, as slow loading times can lead to lost sales and customers.
- High abandoned cart rates: If you’re seeing a lot of customers adding items to their cart but not completing the purchase, it could indicate a problem with your checkout process. Maybe the process is too long or confusing, or maybe you’re not offering enough payment options. Whatever the case may be, it’s important to find out why customers are abandoning their carts and take steps to fix the problem.
- Declining traffic: A decline in traffic can signal a number of different problems, from changes in Google’s algorithms to problems with your website design. It’s important to investigate any declines in traffic so you can identify the root cause and take steps to fix it.
Choosing the Right eCommerce Dashboard
When it comes to eCommerce dashboards, there is no one-size-fits-all solution. The right dashboard for your company will depend on a number of factors, including the size of your business, the nature of your products, and your specific needs. Here are a few factors to consider when making your decision:
- What features do you need? The first step is to identify the most important features to your business. Do you need a dashboard that can track inventory levels? Are you looking for a way to understand your customer data better? Once you know what you need, you can narrow down your options and find a dashboard that meets your specific needs.
- What is your budget? Another important factor to consider is your budget. Dashboards can vary widely in price, so it’s important to find one that fits within your budget. Keep in mind that more expensive dashboards often offer more features and customization options.
- What is your level of technical expertise? Another thing to consider is your own level of technical expertise. If you’re not comfortable working with complex software, then you’ll want to choose a dashboard that is easy to use and set up. On the other hand, if you’re familiar with coding and web development, you may take advantage of more advanced features.
By taking the time to consider these factors, you can find an eCommerce dashboard that’s right for your business.
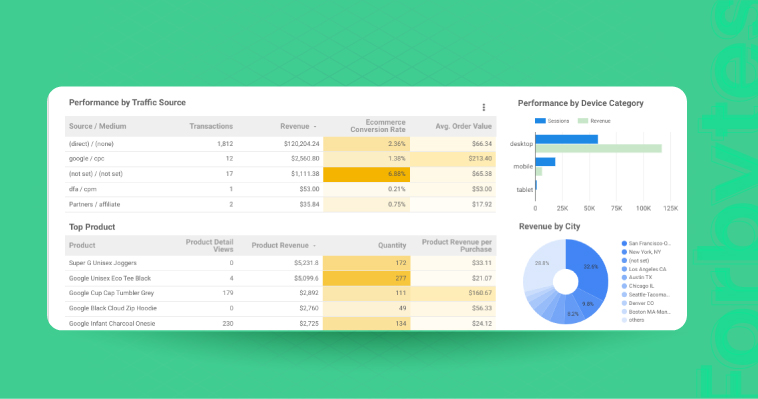
KPIs and Metrics for Ecommerce Dashboards
Here are some of the most important metrics to keep an eye on on your dashboard:
- Sales: This is the most obvious metric to track, and it’s important to track both overall sales and sales by product category. This will give you insights into which products are selling well and where you may need to make adjustments.
- Conversion rate: This metric measures how many of your visitors are taking action, whether that’s making a purchase, signing up for a newsletter, or taking some other desired action. A high conversion rate indicates that your store is effectively converting visitors into customers.
- Average order value: This metric measures how much each customer spends, on average, when they make a purchase. A high average order value indicates that your customers are spending more per transaction, which can be a sign of a healthy store.
- Traffic sources: It’s important to track where your traffic is coming from so you can ensure that you’re driving traffic from sources that are likely to convert users into customers. For instance, if you’re driving a lot of traffic from social media but not seeing many sales, that’s an indication that you need to focus on driving traffic from other sources.
By tracking all of these data points, you can get a comprehensive view of your business and identify areas where you need to improve. Selecting the KPIs and metrics most relevant to your business goals is important. Otherwise, you may end up with a dashboard that is overwhelming and difficult to interpret.
Dashboard Metrics to Check If Your Store is Working
Your store’s dashboard is a wealth of information. It can tell you at a glance how your business is doing, what areas need improvement, and where you might have issues.
While it’s important to check all of your dashboard metrics regularly, there are some that are particularly useful for spotting potential problems. For example, if your conversion rate turns low suddenly, it could be an indication that something is wrong with your site or your checkout process.
Similarly, a high abandoned cart rate could indicate that your customers are having difficulty completing their purchases. By keeping an eye on key dashboard metrics, you can quickly identify potential problems and take steps to address them.
Inventory
As anyone who has ever managed inventory knows, keeping track of stock levels is essential to avoid costly shortages or surpluses. But knowing which metrics to track can be a challenge. There are a few essential dashboard metrics that every inventory manager should keep an eye on, including:
- Stock levels: This metric measures the amount of inventory on hand at a given time. It’s important to track stock levels so that you can reorder supplies before they run out.
- Lead time: This metric measures the amount of time it takes for new inventory to arrive after an order is placed. Keeping tabs on lead time is essential for ensuring that you have the supplies you need when you need them.
- Turnover rate: This metric measures how often your inventory turns over or how quickly you sell through your stock. A high turnover rate is generally desirable, as it means you’re selling through your inventory quickly. However, a too-high turnover rate can be a sign of problems, such as shortage or poor forecasting.
By tracking these essential dashboard metrics, you’ll be able to manage your inventory better and avoid costly mistakes.
Promotions/Marketing
Marketing is essential for any business that wants to promote its products or services. However, with so many different channels and strategies to choose from, it can be difficult to know where to focus your efforts. This is where dashboard metrics can be extremely helpful.
You can better understand which promotions have the greatest impact by tracking key performance indicators (KPIs) such as website traffic, social media engagement, and conversion rates.
Additionally, you can use dashboard metrics to track your marketing budget and ROI, ensuring that you are getting the most bang for your buck. With the right dashboard in place, you can take the guesswork out of marketing and focus on what is truly important: growing your business.
Shipping
Every business should track a few shipping metrics, including delivery times, package tracking, and customer satisfaction. By closely monitoring these, you can identify areas where your shipping process could be improved.
For example, if you notice delivery times are consistently longer than expected, you may need to invest in faster shipping methods. Or, if customers are frequently reporting lost or damaged packages, you may need to invest in better packaging materials. Paying attention to your shipping metrics ensures that your orders’ paths are smooth and efficient.
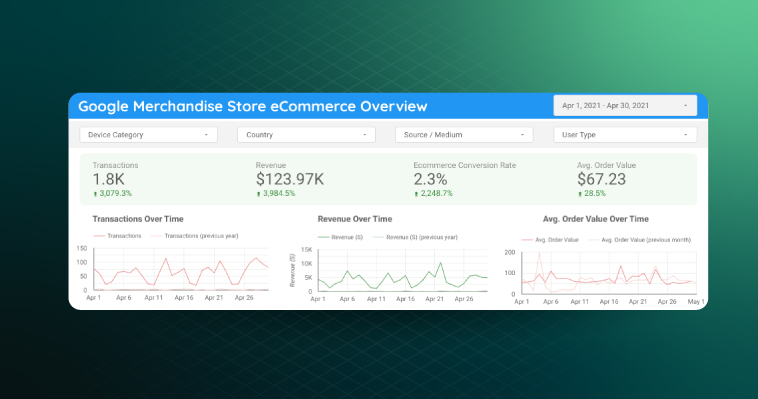
Weekly/Monthly Store Performance Dashboards
Dashboards provide a snapshot of key performance indicators (KPIs) and can be customized to show data for specific timeframes (weekly, monthly, etc.). This makes them an essential tool for measuring progress and identifying areas of improvement. For example, if you notice that sales are falling on certain days of the week, you can take steps to improve store operations on those days. Or, if you notice that customer satisfaction is declining, you can investigate the root cause and implement changes to improve the shopping experience. Regularly reviewing your store performance dashboard can help you keep your finger on the pulse of your business and make data-driven decisions to improve store performance.
Marketing Performance Dashboards
A marketing performance dashboard is a tool that allows marketing professionals to track key metrics and KPIs related to their campaigns and initiatives. By tracking these metrics, marketing teams can identify areas of improvement and optimize their strategies accordingly. Additionally, dashboards can help marketing teams identify trends and patterns over time, which can inform future decisions. While there are many different types of marketing performance dashboards available, they all share one common goal: to help marketing teams improve their performance and drive better results.
Customer Support Dashboards
A customer support dashboard is a powerful tool that can help businesses keep track of customer interactions and measure satisfaction levels. By tracking customer experience, companies can identify areas where customers are struggling and make improvements.
Additionally, customer support dashboards often include data on wait times, average handle times, and first-call resolutions. This data can be used to gauge the effectiveness of customer support staff and make changes accordingly. Moreover, by tracking sentiment data, businesses can get a better understanding of how customers feel about their experience.
Final Word
Any business that wants to be successful in the modern world needs to have an online presence. An eCommerce dashboard is a key part of this, as it provides a central location from which you can manage all aspects of your online business.
Ready to take your business to the next level? Contact us, and we’ll help you achieve new heights in the eCommerce business world.